|
Expansion of Hong Kong International Airport into a Three-Runway System |
|
|
|
Contents |
Chapter
Title
Page
Tables
Figure
2.1 CWD Vessel Transects in
Baseline Monitoring
Figure
2.2 Land-based Dolphin Monitoring
Locations during Baseline Monitoring, indicated by blue triangles
Figure 2.3
Location for Autonomous Passive Acoustic Monitoring during Baseline Monitoring
Figure 3.1
Sightings Distribution of Chinese White Dolphins
Figure 3.2
Sightings Distribution of Finless Porpoises
Figure 3.3
Distribution of Chinese White Dolphins with Different Group Sizes
Figure 3.4
Distribution of Finless Porpoises with Different Group Sizes
Figure 3.5
Distribution of Chinese White Dolphins Engaged in
Different Behaviours
Figure 3.6
Sighting Locations of Mother and Calf Pairs
Figure 3.7 Plots of First
Sightings of All CWD Groups (prior to filtering out short-track data) obtained
from Land-based Stations
Figure 3.8 CWD Groups
Sighted (per hour of effort) and Tracked from Lung Kwu
Chau (prior to filtering binned data) based on
Time of Day
Figure 3.9 CWD Groups
Sighted and Tracked from Lung Kwu Chau based on Month
of the Year
Figure 3.10 Plots of CWD Short-track
Positions (Standardized Segments) relative to Group Size obtained from Lung Kwu Chau
Figure 3.11 Plots of CWD Short-track
Positions (Standardized Segments) relative to Group Size obtained from Sha Chau
Figure 3.12 Percentages of CWD
Behavioural States, excluding Unknown Category, recorded from Lung Kwu Chau
Figure 3.13 Plots of All Vessel Positions
and All CWD Positions (prior to filtering out short-track data) obtained from
Lung Kwu Chau
Figure 3.14 Plots of All Vessel Positions
and All CWD Positions (prior to filtering out short-track data) obtained from
Sha Chau
Figure 3.15 Dolphin Detections as
Percentage of Files Per Day, 8 January to 13 May 2016
Figure 3.16 Dolphin Detections as
Percentage of Files Per Day from Previous Airport
Monitoring Project, 8 January to 29 March 2013
Figure 3.17 Dolphin Detections by Hour of
Day, 8 January to 13 May 2016
Figure 3.18 Daily Mean Sound Pressure Level
(dB rms re 1 µPa), 8 January to 13 May 2016
Figure 3.19 Daily mean Sound Pressure
Level for Site A5 during Previous Airport Project, 2012-2013
Figure 3.20 Sound Pressure Level (SPL) by
hour of day, 8 January to 29 March 2016
Figure 3.21 Sound Pressure Level (SPL) by
Hour of Day, 14 April to 13 May 2016
Figure 4.1 Quarterly Encounter
Rates of AFCD’s Monitoring Data
Figure 4.2 Quarterly
Encounter Rates and Running Average Encounter Rates of AFCD’s Monitoring Data
Appendix A
Survey Effort Database
Appendix B
Sighting Database
Appendix C
Photo Identification Catalogue
Appendix D
Re-sightings of Identified CWD Individuals
Appendix E
Land-based Tracking and CWD Sightings by Survey
Date
1
Introduction
|
1.1
Background
On 7 November 2014, the Environment
Impact Assessment (EIA) for the proposed “Expansion of Hong Kong International
Airport into a Three-Runway System” (AEIAR-185/2014, hereafter referred to as
“the Project”) was approved and an Environmental Permit (EP) (EP-489/2014) for
the construction and operation of the Project was issued by the Environmental
Protection Department (EPD).
On 29 April 2016, Airport Authority
Hong Kong (AAHK) received the Chief Executive-in-Council’s approval for draft Chek Lap Kok Outline Zoning Plan,
as well as the authorization of the reclamation under the Foreshore and Sea-bed
(Reclamations) Ordinance for the expansion of Hong Kong International Airport
(HKIA) into a three-runway system.
Mott MacDonald Hong Kong Limited
(MMHK) was commissioned by the AAHK to undertake the role of Environmental Team
(ET) for carrying out the Environmental Monitoring and Audit (EM&A) works
during the construction phase of the Project in accordance with the Updated
EM&A Manual. A six-month baseline monitoring on Chinese White Dolphin (CWD,
also known as the Indo-Pacific Humpback Dolphin, Sousa chinensis)
was proposed under the Updated EM&A Manual before the commencement of
land-formation related construction works. This CWD baseline monitoring report
has the aim of summarising the findings of the baseline monitoring results to
establish pre-construction conditions prior to the commencement of the marine
construction works. The values of Action and Limit Levels for CWD monitoring
during the construction of the project are proposed based on the findings of
this baseline report for consolidating the Event Action Plan as part of the
EM&A.
1.2
Project
Description
The project covers the expansion of
the existing airport into a three-runway system (3RS) with key project
components comprising land formation of about 650 ha and all associated
facilities and infrastructure including taxiways, aprons, aircraft stands, a
passenger concourse, an expanded Terminal 2, all related airside and landside
works and associated ancillary and supporting facilities. The existing
submarine aviation fuel pipelines and submarine power cables also require
diversion as part of the works.
Construction will proceed in the
general order of diversion of the submarine aviation fuel pipelines, diversion
of the submarine power cables, land formation, and construction of
infrastructure, followed by construction of superstructures. The land-based
construction works of horizontal directional drilling (HDD) for diversion of
the submarine aviation fuel pipelines were commenced on 28 December 2015 on the
airport island. Other construction works are targeted to commence from 1 August
2016.
1.3
Purpose
of this Report
This Chinese White Dolphin Baseline
Monitoring Report is submitted to fulfil the requirements stated in Sections
10.2.3, 10.2.4, 10.5 and 10.6.1 of the Updated EM&A Manual and the baseline
monitoring has been undertaken based on the approach and methodology presented
in the Updated EM&A Manual. The Action and Limit Levels for CWD were
established based on the review of historical information and the recent data
collected under this baseline study.
2
Baseline
Monitoring Methodology
|
2.1
Introduction
The
CWD baseline monitoring was undertaken between 18 December 2015 and 17 June
2016, covering small vessel line-transect surveys, land-based surveys and
theodolite tracking, and passive acoustic monitoring. This section provides the
details of baseline monitoring methodology for the CWD.
2.2
Small
Vessel Line-transect Surveys
Small vessel line-transect surveys provided data for density and
abundance estimation and other assessments using distance-sampling
methodologies, specifically, line-transect methods. These surveys also
included photo-identification of individual dolphins within the monitoring area
when conditions were suitable, to provide data on individual use of this
specific area. Focal follow data from the vessel survey were also
collected where feasible, depending on a series of factors, such as the
presence of special features for identification of individuals (like presence
of scratches, nick marks, cuts, wounds and distinguished colour patterns) and
favourable weather conditions.
The surveys involved small vessel line-transect data collection and have
been designed to be similar to, and consistent with, previous surveys for
Agriculture, Fisheries and Conservation Department (AFCD) monitoring of small
cetaceans in Hong Kong. The survey was designed to provide systematic,
quantitative measurements of density, abundance and habitat use.
The transects covered Northeast Lantau (NEL), Northwest Lantau (NWL)
covering the Airport West (AW), West Lantau (WL) and Southwest Lantau (SWL) as
proposed in the Updated EM&A Manual and are consistent with the AFCD
long-term monitoring programme (except AW). There are two types of transect
lines:
· Primary transect
lines: the parallel and zigzag transect lines as shown in Figure 2.1; and
· Secondary transect lines: transect lines connecting between the
primary transect lines and crossing islands.
All on-effort data collected under conditions of Beaufort 0-3 and
visibility of approximately 1200 m or greater, on both primary and secondary
transect lines, were used for analysis. The AW transect has not been previously
surveyed in the AFCD programme due to the restrictions of HKIA Exclusion Zone,
nevertheless, this transect was established during the EIA of the 3RS project
with the aim to collect project specific baseline information within the HKIA
Approach Area to fill the data gap that was not covered by the AFCD programme.
This provided a larger sample size for estimating the densities and patterns of
movements in the broader study area of the project.
A 15-20 m vessel with a flying bridge observation platform about 4 to 5
m above water level and unobstructed forward view, and a team of three to four
observers were deployed to undertake the surveys. Two observers were on
search effort at all times when following the transect lines with a constant
speed of 7 to 8 knots (i.e. 13 to 15 km per hour), one using 7X handheld
binoculars and the other using unaided eyes and recording data.
When CWDs were seen, the observer team was taken off-effort, the
dolphins were approached and photographed for photo-ID information (using a
Canon 7D [or similar] camera and long 300 mm+ telephoto lens), then followed
until they left the study area or were lost. At that point, the boat
returned (off effort) to the next survey line and began to survey on effort
again. Survey was postponed when visibility was below 1200 m and/or when
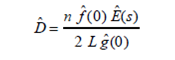
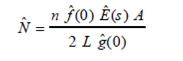
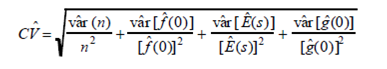
Beaufort 5 was reached. CWD density (D), abundance (N), and their associated
precision (CV) will only be presented when 12-month monitoring data by
conventional line transect methods is available. These will be based on dolphin
sightings and effort data collected under conditions of Beaufort 0-3 and
visibility of approximately 1200 m or greater. The formulae as detailed below
(see Jefferson 2000):
Based on the vessel survey data, seasonal differences
in dolphin density and use of the study area will be examined, using the solar
seasons (Winter: December-February, Spring: March-May,
Summer: June-August, Autumn: September-November) and/or oceanographic seasons
(Dry: October-March, Wet: April-September).
Focal follows of dolphins were conducted during this
6-month baseline survey where practicable (i.e. when individual dolphins or
small stable groups of dolphins with at least one member that could be readily
identifiable with unaided eyes during observations and weather conditions are
favourable). These involved the boat following (at an appropriate
distance to minimize disturbance) an identifiable individual dolphin for an
extended period of time, and collecting detailed data on its location,
behaviour, response to vessels, and associates. This type of data allows
information to be gathered on the movement paths and travel corridors used by
dolphins in the survey region. The data collected were comparable to data
being collected during focal follows in the AFCD-funded long-term monitoring
surveys, and the combined dataset of both sets of focal follows allows the
evaluation of travel corridors for the greater Hong Kong region to be
undertaken, with potential emphasis on and near the land formation area.
Two full sets of transect surveys covering all
transects in the survey areas were completed per survey month (survey months
were considered as being from 18 December 2015 to 17 January 2016, from 18
January to 17 February 2016, and so on).
2.3
Land-based
Surveys and Theodolite Tracking
Land-based
monitoring obtains fine-scale information on the time of day and movement
patterns of the CWDs. A digital theodolite (Sokkia/Sokkisha
Model DT5 or similar equipment) with 30-power
magnification and 5-s precision was used to obtain the vertical and horizontal angle of each
dolphin and vessel position. Angles
were converted to geographic coordinates (latitude and longitude) and
data were recorded using Pythagoras software, Version 1.2 (Gailey &
Ortega-Ortiz, 2002). This
method delivers precise positions of multiple
spatially distant targets in a short amount of time. The
technique is fully non-invasive, and allows for time and cost-effective
descriptions of dolphin habitat use patterns at all times of daylight (Würsig et al. 1991; Piwetz et al.
2012). Examples of modern statistical techniques to describe movements
relative to habitat and anthropogenic influences are described in Gailey et al.
(2007) and Lundquist et al. (2012).
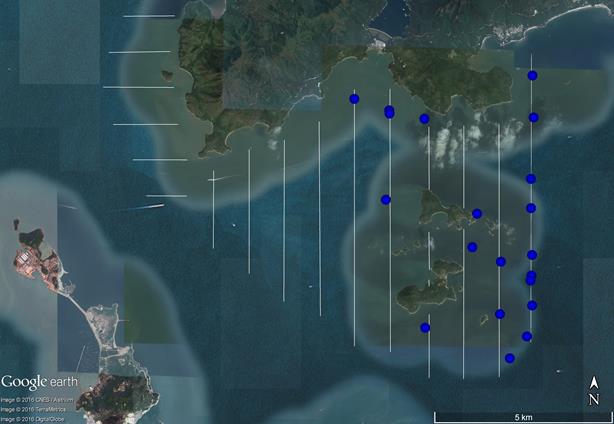
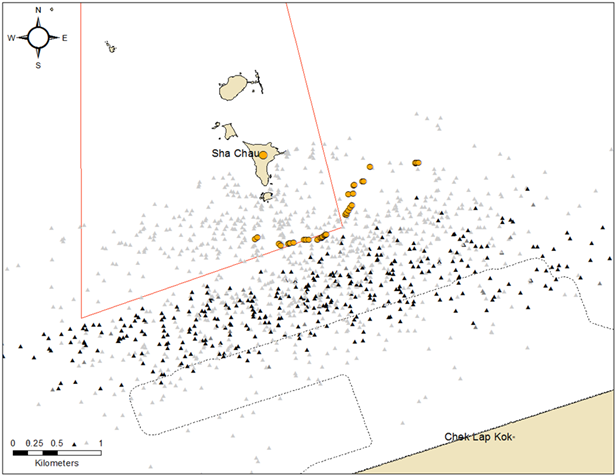
Land-based
observation and theodolite tracking stations were set up at two locations
facing east/south/west on the southern slopes of the island of Sha Chau (SC),
and an audit location for SkyPier High Speed Ferries
(HSF) facing north/northeast/northwest, at Lung Kwu
Chau (LKC). The locations (D and E) are shown with position coordinates,
height of station and approximate distances of consistent theodolite tracking
capabilities for CWDs in Table 2.1 and Figure 2.2.
Table 2.1:
Land-based Survey Stations Details
|
Station |
Location |
Geographical Coordinates |
Station Height (m) |
Approx. Tracking Distance (km) |
|
D
|
SHA CHAU
|
22° 20’ 43.5” N 113° 53’ 24.66” E |
45.66 |
2 |
|
E |
LUNG KWU CHAU |
22° 22’ 44.83” N 113° 53’ 0.2” E |
70.40 |
3 |
The frequency of the theodolite
tracking was two days per month at the SC station and three days per month at
the LKC Station (one more survey day conducted for LKC station than the SC
station for auditing the SkyPier High Speed Ferries
(HSFs) Route Diversion and Speed Restriction Plan) during the six-month
baseline monitoring. Surveys were undertaken during a period of about 5-6 hours
per survey day from the monitoring station, with some days longer than this but
others truncated due to weather-related deterioration of sighting conditions.
Three surveyors (one theodolite operator, one computer operator, and one
observer) were involved in each survey. Observers searched for dolphins using
unaided eyes and handheld binoculars (7X50). Theodolite tracking sessions were
initiated whenever an individual CWD or group of CWDs was located. Where
possible, a distinguishable individual was selected, based on colouration,
within the group. The focal individual was then continuously tracked via
the theodolite, with a position recorded each time the dolphin surfaced. In
case an individual could not be positively distinguished from other members,
the group was tracked by recording positions based on a central point within
the group whenever the CWDs surfaced (Bejder, 2005;
Martinez, 2010). Tracking continued until animals were lost from view, moved
beyond the range of reliable visibility (>1-3 km, depending on station
height), or environmental conditions obstructed visibility (e.g., intense haze,
Beaufort sea state >4, or sunset), at which time
the research effort was terminated. In addition to the tracking of CWDs,
all vessels that moved within 2-3 km of the station were tracked, with effort
made to obtain at least two positions for each vessel.
Theodolite
Tracking Data Analysis
Theodolite tracking included focal
follows of CWD groups and vessels. Priority was given to tracking individual or
groups of CWDs. We also attempted to track all vessels moving within 1 km of
the focal CWDs. Focal follow data were filtered to include only CWD tracks with
greater than 2 positional fixes and 10 minutes or greater in duration. If two
consecutive dolphin tracks were more than 10 minutes apart, they were split and
analysed separately. Because CWD focal follows varied in duration, to standardize
data, each CWD track was split into 10-minute segments, comprising 6
interpolated positional fixes per segment. The ten minute window has been
statistically validated for theodolite tracking analyses (Gailey et al. 2007,
Lundquist 2012), and such a logical bound is also described in Turchin (1998). Standardized data were used to
analyse group size and behaviour and will be used for future analyses of
movement patterns. CWD response variables that will be calculated for each
track include mean reorientation rate, swimming speed and linearity.
Reorientation rate is the degrees per minute of changes in direction of a
tracked individual or group of CWDs. Mean swimming speed is calculated by
dividing the distance travelled by the duration between two consecutive
positions (Gailey et al. 2007). Linearity is an index of net movement ranging
from 0 to 1, with 0 equating to no net movement and 1 equating to straight line
movement. It is calculated by taking the sum of distances travelled for each
segment and dividing by the net distance between the first and last fix of a
track.
In order to evaluate variation in
CWD movement patterns in the presence of vessels, it is necessary to establish
a distance threshold. Consistent with general practice and the data gathered
for the EIA of this study, when vessels are within 500m of the focal individual
or group, they are considered present. The 500m threshold was chosen since Sims
et al. (2012) showed that most vessels exceeded background noise when less than
500m away, but not at greater distances. The threshold has been used in
other marine mammal situations for similar reasons and direct measurement of
animal reactions, such as in Lundquist et al. (2012) for southern right whales
(Eubalaena australis).
As it is not possible to record geographic locations of all targets
simultaneously, positions for CWDs and vessels were interpolated post hoc (i.e.
during analysis in the lab), allowing for a more precise estimation of vessel
distances from dolphins at a given time. All types of vessels within 500m
will be considered, including high speed ferries. The high speed ferries
travel through the area much more rapidly than fishing, recreational, and
industrial vessels carrying cargo and will therefore be noted and assessed as a
separate category.
ArcMap was used to plot CWD and vessel
positions, Microsoft Excel was used to conduct computational
analysis and R statistical software was used to perform statistical analyses.
Data were tested for normality and transformed when residuals were not normally
distributed. In order to reduce pseudo-replication, analysis was run to
determine the temporal lag at which two segments from the same focal group are
no longer auto-correlated. Univariate statistical analyses (one-factor Analysis
of Variance, ANOVA) were run to evaluate variation between factors.
Similar to vessel-based surveys,
seasonal differences in relative CWD relative occurrence and use of the study
area were examined for land-based surveys, using both the solar seasons
(Winter: Dec-Feb, Spring: Mar-May, Summer: Jun-Aug, Autumn: Sep-Nov) and
oceanographic seasons (Dry: Oct-Mar, Wet: Apr-Sep; see Chen et al. 2010). In
addition, behavioural descriptions and potential avoidance/association by CWDs
relative to vessels or other on-water anthropogenic activities will be analysed
by multi-variate analyses, as in Gailey et al. (2007) and Lundquist et al
(2012).
2.4
Passive
Acoustic Monitoring
Acoustic data were gathered to listen for CWDs
occurrence patterns and to obtain anthropogenic noise information
simultaneously. This work involves a type of Passive Acoustic Monitor (PAM)
(Wiggins and Hildebrand 2007) termed an Ecological Acoustic Recorder (EAR) (Lammers et al. 2008), with bottom-mounted broad-band recording
capability operable from 20 Hz (for lower frequency anthropogenic noise) up to
a flat response of 32kHz (for echolocating and
communicating CWDs). An EAR was positioned at south of Sha Chau Island to
coincide with the land based theodolite survey (Figure
2.3). The duty cycle of the PAM was 20% for the baseline and
construction phases.
Analysis (by a specialized team of
acousticians) involved manually browsing through every acoustic recording and
logging the occurrence of dolphin signals. This approach for data analysis was
adopted because generally high ambient noise conditions in these waters have
meant that an automatic algorithm cannot be reliably used to detect dolphin
sounds. All data therefore were re-played by computer and listened to by
human ears for accurate assessment of dolphin group presence. In addition,
ambient sound levels were quantified using a customised Matlab
algorithm over the entire effective bandwidth and within frequency bands of 0-2
kHz, 2-4 kHz, 4-8 kHz, 8-16 kHz, and 16-32 kHz.
Comparisons of CWD and vessel sounds
during theodolite tracks of those dolphins and vessels were made post hoc, that
was after both sets of data have been separately analysed in the laboratory,
positions were known, and the positions can be compared to loudness and
frequencies of those sounds.
A review of CWD sightings from the
land-based survey data in relation to the EAR device was also undertaken to
provide data on the approximate locations of the CWDs at the time their signals
were detected. Thus, overlaps of land-based CWD sightings and the EAR recorded
sounds of CWDs were analysed.
3
Monitoring
Results
|
3.1
Small Vessel Line-transect Survey
3.1.1
Survey Effort
During the monitoring period of 18
December 2015 to 17 June 2016, two sets of small vessel line-transect surveys
were conducted per survey month covering NEL, NWL, AW, WL and SWL. In other
words, a total of 12 sets of transect covering the above-mentioned survey areas
were conducted during the six-month baseline monitoring period.
A total of 2,841.29 km of survey
effort was collected during the six-month baseline monitoring period, with
90.9% of the total survey effort (i.e. 2,583.73 km) being conducted under favourable
weather conditions (i.e. Beaufort Sea State 3 or below). Details of survey
effort are presented in Appendix A.
3.1.2
Sighting Distribution
During the six-month baseline
monitoring, a total number of 83 groups of 353 CWDs were sighted, of which 80
groups of 339 individuals were sighted under favourable weather conditions,
including 71 on-effort sightings and nine off-effort sightings.
In addition to CWDs, Indo-Pacific
Finless Porpoises (FPs) (Neophocaena phocaenoides) were also sighted in SWL during the baseline monitoring. A total number
of 23 groups of 115 individuals including 20 on-effort sightings and three
off-effort sightings were recorded under favourable weather conditions. CWD and
FP sightings information are presented in detail in Appendix B and summarised in Table 3.1.
Table 3.1: Summary of Dolphin and Porpoise Sightings
|
|
On-effort Sightings Under Favourable Weather Conditions (i.e. Beaufort 0 to 3) |
All Sightings |
||||||||
|
NL |
WL |
SWL |
Overall |
No. of |
No. of Individuals |
|||||
|
No. of Sightings |
No. of Individuals |
No. of Sightings |
No. of Individuals |
No. of Sightings |
No. of Individuals |
No. of Sightings |
No. of Individuals |
|||
|
CWD |
17 |
76 |
33 |
142 |
21 |
96 |
71 |
314 |
83 |
353 |
|
FP |
N/A |
N/A |
N/A |
N/A |
20 |
101 |
20 |
101 |
23 |
115 |
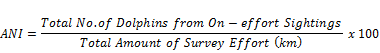
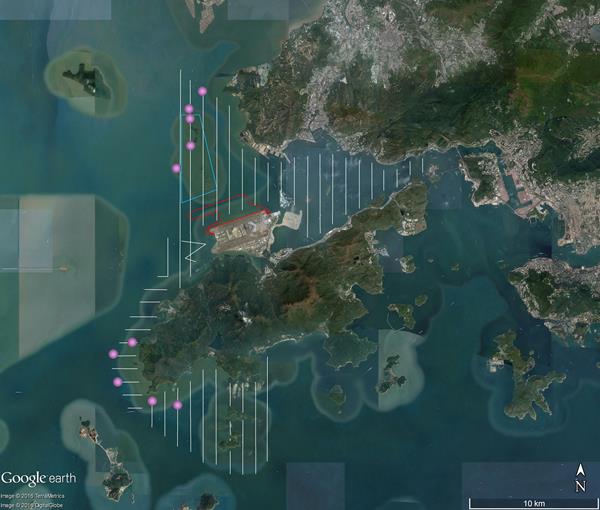
Sighting distribution of CWDs during
on-effort survey and under favourable weather condition is presented in Figure 3.1. CWDs occurred
in all survey areas except NEL. Sightings from NEL, NWL and AW within the North
Lantau waters were combined as NL for the following discussion. In North Lantau
waters (i.e. NEL, NWL and AW), CWDs mostly occurred in areas around Sha Chau
and Lung Kwu Chau Marine Park (SCLKCMP), particularly
at the northern and western waters of the marine park. In West Lantau waters,
some CWD sightings occurred around Tai O. Other sightings within West Lantau
survey area from Yi O to Fan Lau with the majority recorded relatively
off-shore except a few recorded close to the coast of Peaked Hill (Kai Yet Kok) and Fan Lau. In southwestern waters of Lantau, CWDs
frequently occurred along the coast from Fan Lau to Shek
Pik. CWDs were also occasionally recorded in areas
around Soko Islands.
Sighting locations of FPs recorded
during the baseline monitoring are shown in Figure 3.2. During the baseline monitoring, FPs
were only recorded in the SWL survey area. They were mainly recorded on
transects between Shek Pik
and Tong Fuk, and also waters around Soko Islands, with the majority of the sightings clustered
around the eastern part of the SWL survey area.
Although CWDs and FPs co-occurred in
SWL waters, CWDs dominated in the western part while FPs were
more frequently sighted in the east.
Figure 3.1: Sightings Distribution of
Chinese White Dolphins
[Pink circle: Sighting locations of
CWD, White line: Vessel survey transects, Blue polygon: Sha Chau and Lung Kwu Chau Marine Park (SCLKCMP), Red polygon: 3RS
land-formation footprint]
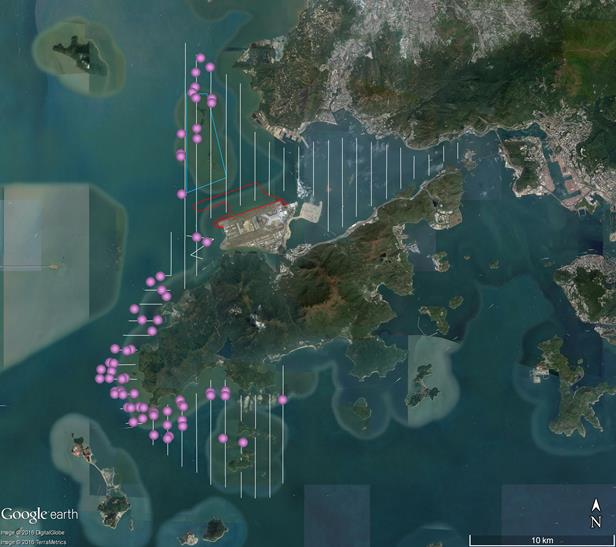
Figure 3.2:
Sightings Distribution of Finless Porpoises
[Blue spot: sighting locations of FP, White line: Vessel survey transects]
3.1.3
Encounter Rate
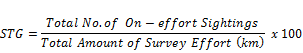
Two
types of dolphin encounter rates were calculated based on the records of CWD baseline
monitoring. They included the number of dolphin sightings per 100km survey
effort (STG) and total number of dolphins per 100km survey effort (ANI). In the
calculation of dolphin encounter rates, only survey data collected under
favourable weather condition (i.e. Beaufort 0-3) were used, since detection
capability of cetacean tends to be biased in Beaufort conditions higher than 3.
Formulation of the encounter rates are shown as below:
Encounter Rate of Number of Dolphin
Sightings (STG)
Encounter Rate of Number of Dolphins (ANI)
(Notes: Only
data collected under Beaufort 3 or below condition was used)
The STG and ANI for the combined
survey area in each survey month and for survey quarters are summarised in Table 3.2 and Table 3.3
for this 6-month baseline survey period. The results show that the lowest
record for STG was during the first survey month i.e. 18 December 2015 to
17 January 2016 and the quarterly STG was also observed to be the lowest in the
first survey quarter between 18 December 2015 and 17 March 2016.
Table 3.2: Monthly and Quarterly STG and ANI for
Combined Survey Areas (NEL, NWL, AW, WL, SWL)
|
Survey Month Number |
Survey Period |
No. of Sighting |
No. of Dolphin |
On-Effort (km) |
m ER (STG) |
m ER (ANI) |
*Run STG |
*Run ANI |
|
1 |
18 Dec 2015 to 17 Jan 2016 |
6 |
37 |
436.049 |
1.38 |
8.49 |
|
|
|
2 |
18 Jan 2016 to 17 Feb 2016 |
10 |
61 |
446.783 |
2.24 |
13.65 |
|
|
|
3 |
18 Feb 2016 to 17 Mar 2016 |
9 |
28 |
464.582 |
1.94 |
6.03 |
1.86 |
9.35 |
|
4 |
18 Mar 2016 to 17 Apr 2016 |
11 |
30 |
412.931 |
2.66 |
7.27 |
2.27 |
8.99 |
|
5 |
18 Apr 2016 to 17 May 2016 |
15 |
80 |
452.975 |
3.31 |
17.66 |
2.63 |
10.37 |
|
6 |
18 May 2016 to 17 Jun 2016 |
20 |
78 |
370.405 |
5.40 |
21.06 |
3.72 |
15.21 |
|
|
Total |
71 |
314 |
2583.725 |
Notes:
1.
Both Effort and Sighting have excluded data collected at Beaufort 4 or above.
2.
m ER denoted monthly Encounter
Rate
3.*Running
STG and Running ANI were calculated by combining three preceding survey months
data (e.g. STG/ANI for Survey Month 3 were calculated by combining the data
between 18 Dec 2015 and 17 Mar 2016, STG/ANI for Survey Month 4 were calculated
by combining the data between 18 Jan 2016 to 17 Apr 2016)
Table
3.3: Quarterly
STG and ANI for Combined Survey Areas (NEL, NWL, AW, WL, SWL)
|
Combined (NEL, NWL, AW, WL, SWL) |
STG |
ANI |
|
18 Dec 2015 to 17 Mar 2016 |
1.86 |
9.35 |
|
18 Jan 2016 to 17 Apr 2016 |
2.27 |
8.99 |
|
18 Feb 2016 to 17 May 2016 |
2.63 |
10.37 |
|
18 Mar 2016 to 17 Jun 2016 |
3.72 |
15.21 |
In regard of summarising all the
six-month baseline survey data, the combined STG and ANI of all survey areas
were 2.75 and 12.15 respectively. In respect of separate survey areas,
standalone STG and ANI for NL (including NEL, NWL and AW) were 1.15 and 5.15
respectively. No CWD was recorded in NEL during the current study period. In WL,
the STG and ANI of CWD were 9.53 and 41.01 respectively. For SWL, the STG and
ANI of CWD were 2.75 and 12.59. Amongst the aforementioned survey areas, the
encounter rates in term of both STG and ANI were the highest in WL, and the
lowest in NL. Table 3.4 summarises the STG and
ANI for NL, WL and SWL.
Table 3.4: STG and ANI for NL, WL, SWL and Combined
Survey Areas
|
|
NL (NEL, NWL, AW) |
WL |
SWL |
Combined |
|
STG |
1.15 |
9.53 |
2.75 |
2.75 |
|
ANI |
5.15 |
41.01 |
12.59 |
12.15 |
Source:
Based on baseline survey data from 18 December 2015 to 17 June 2016
3.1.4
Group Size
Group size of CWD sightings ranged
from one to 19 individuals per group during the baseline monitoring. The
average group size of CWDs was 4.42 ± 3.54. Amongst the 71 groups of CWDs
sighted during the on-effort baseline monitoring under favourable weather
conditions, there were 26 small groups with group size composed of only one to
two dolphins per group, while five were large groups with 10 or more
individuals. The sighting distribution of CWDs with different group sizes was
presented in Figure 3.3.
Group size of FPs ranged from 1 to 15 individuals per group during the baseline
monitoring. The average group size of Finless Porpoises was 5.05 ± 4.58. The
sighting distribution of FPs with different group sizes was presented in Figure 3.4.
Figure 3.3: Distribution of Chinese White Dolphins with Different Group Sizes
[Pink spots: 1-2 individuals, Green
spots: 3-9 individuals, Red spots: 10 or more individuals, White line: Vessel
survey transects, Blue polygon: SCLKCMP, Red polygon: 3RS land-formation
footprint]
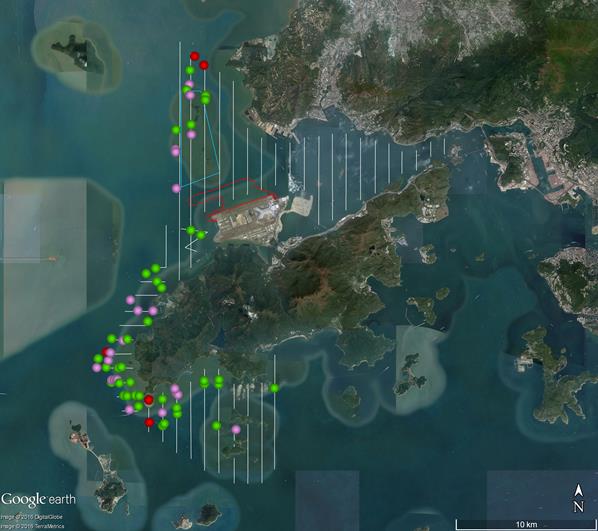
Figure 3.4: Distribution of Finless
Porpoises with Different Group Sizes
[Pink spots: 1-2 individuals, Green
spots: 3-9 individuals, Red spots: 10 or more individuals, White line: Vessel
survey transects]
3.1.5
Activities and Association with Fishing Boats
During the six-month baseline monitoring
period, 29 dolphin sightings were observed with feeding activities. Amongst
these 29 dolphin sightings, five were associated with fishing boats including
single trawlers, purse seiners and gillnetters.
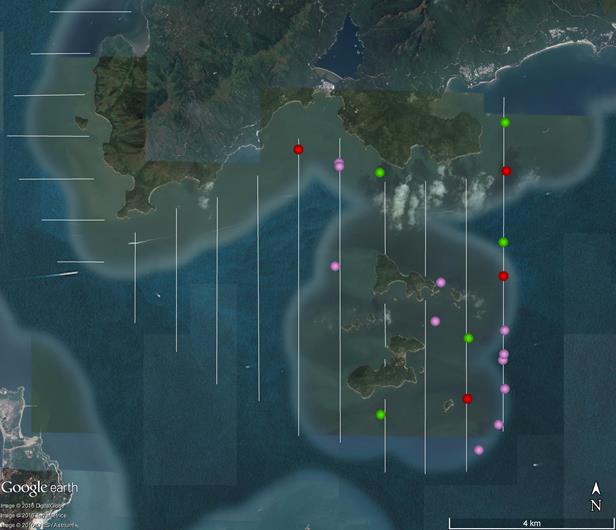
The sighting locations of dolphins
with feeding, socializing, resting and travelling behaviours are shown in Figure 3.5.
Figure 3.5:
Distribution of Chinese White Dolphins Engaged in
Different Behaviours
[Indigo rhombus: Feeding, Green circle: Socializing, Pink square: Resting,
Yellow triangle: Travelling, White line: Vessel survey transects, Blue polygon:
SCLKCMP, Red polygon: 3RS land-formation footprint]
3.1.6
Mother-calf Pairs
In the six-month CWD baseline
monitoring, mother and calf, unspotted juvenile (UJ) or spotted juvenile (SJ)
pairs were observed in 10 sightings (including one sighting recorded under
Beaufort 4). Mother-calf pairs were observed in NWL, WL and SWL between February
and June 2016. Sighting locations of the mother-and-calf pairs were shown in Figure 3.6.
Figure 3.6:
Sighting Locations of Mother and Calf Pairs
[Pink spot: Sighting locations of mother and calf pairs, White line:
Vessel survey transects, Blue polygon: SCLKCMP, Red polygon: 3RS land-formation
footprint]
3.1.7
Summary of Photo-identification Works
In the six-month CWD baseline
monitoring, a total number of 96 CWD individuals were identified based on their
natural markings, like nicks, cuts, scars, wounds, and deformities on their
dorsal fin and body, and also their unique spotting patterns. These 96
identified CWD individuals were added to a newly established
photo-identification catalogue for this Project. The identified dolphins were
divided into three clusters, namely NL, WL and SL based on their first sighting
location. Representative photos of all 96 identified CWD individuals were
presented in Appendix C.
Amongst these 96 identified CWD
individuals, 31 were re-sighted at least twice. The most frequently sighted
individual was SLMM010 which were sighted five times in WL and SWL particularly
areas around Peaked Hill and Fan Lau. SLMM010 is a rather energetic animal that
showed frequent aerial behaviours such as breaching and sky-hopping. There were
three pairs of mother-and-calf, UJ or SJ identified. They were NLMM006 and
NLMM013, WLMM028 and WLMM029 and WLMM036 and WLMM037.
Re-sighting information of CWD
individuals provides an initial idea of their range use and apparent connection
between different areas around Lantau. Individuals like NLMM018, NLMM019,
NLMM021, WLMM021, WLMM027, WLMM028, WLMM029, SLMM003, SLMM007, SLMM010,
SLMM012, SLMM018, SLMM022 and SLMM023 were re-sighted in different survey
areas. The re-sighting locations of those 31 individuals were shown on maps as
presented in the figures of Appendix D.
3.2
Land-based
Surveys and Theodolite Tracking
3.2.1
Survey Effort
The land-based surveys commenced on
28 December 2015, the day that SkyPier HSF route
diversions and speed restrictions were implemented. A total of 29 days
(including 30 survey sessions) and 180:22 (hh:mm) of
land-based theodolite survey effort have been accomplished (Table 3.5). See Table 1 of Appendix E for a detailed description by
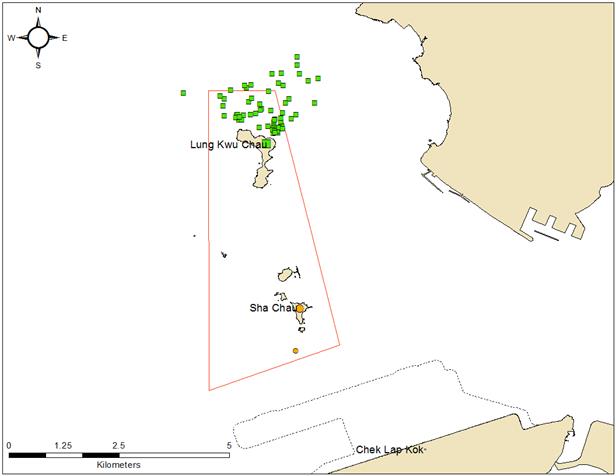
day. A total of 53 CWD groups were tracked from land, all from the LKC station,
except one CWD group was observed from the SC station during this study period
(Table 3.5, Figure 3.7).
After the raw data were filtered, 23 CWD group focal follows fit criteria for
analyses (Table 3.5). From these focal follow
tracks, 33 10-minute segments were extracted for analyses (Table 3.5). CWD group sighting per survey effort was
the greatest from LKC (0.48).
Table 3.5:
Land-based Survey, Theodolite Effort and CWD Group Summary
|
Land-based Station |
# of Survey Sessions |
Survey Effort (hh:mm) |
# CWD Groups Sighted |
CWD Group Sighting per Survey Hr |
# Groups After Filtering |
# of 10-minutes segments |
|
Sha Chau |
12 |
72:23 |
1 |
0.014 |
1 |
3 |
|
Lung Kwu Chau |
18 |
107:59 |
52 |
0.48 |
22 |
30 |
|
TOTAL |
30 |
180:22 |
53 |
0.29 |
23 |
33 |
Figure 3.7: Plots of First Sightings of All
CWD Groups (prior to filtering out short-track data) obtained from Land-based
Stations
[Large green
square on land: LKC station; Small green squares: CWD groups off LKC;
Large orange circle on land: SC station; small orange circle: CWD group off SC
Red line: SCLKCMP boundary]
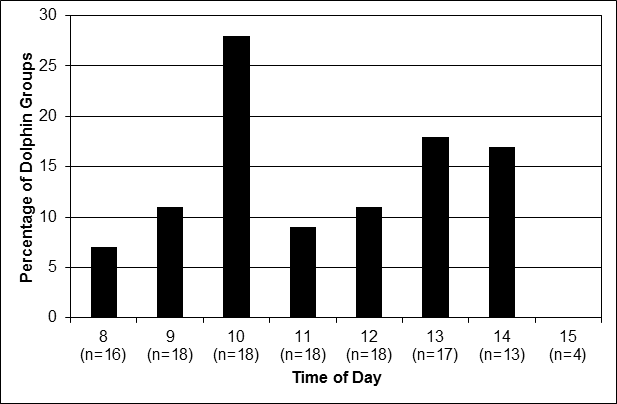
3.2.2
Time of Day
The diurnal pattern of CWD relative
occurrence per station was calculated by dividing the sum of CWD groups tracked
(based on the hour block in which they were first sighted, prior to filtering
data) by the effort per hour block. These percentages give a good
representation of times that groups moved into view at each station, but since
they are first recordings of a group, they do not by themselves give indication
of length of stay within the survey area. Off LKC, the highest percentage of
CWD groups (per hour of effort) were first observed during the 1000 hour block
(27.60%) (Figure 3.8).
The only group recorded off SC was first observed during the 1100 hour block.
Figure 3.8: CWD Groups Sighted (per hour of effort) and Tracked from Lung Kwu Chau (prior to filtering binned data) based on Time of
Day
[Time indicates the hour block when group was first
sighted. The "n" in parentheses represents the number of days that
survey effort was carried out during the associated hour block.]
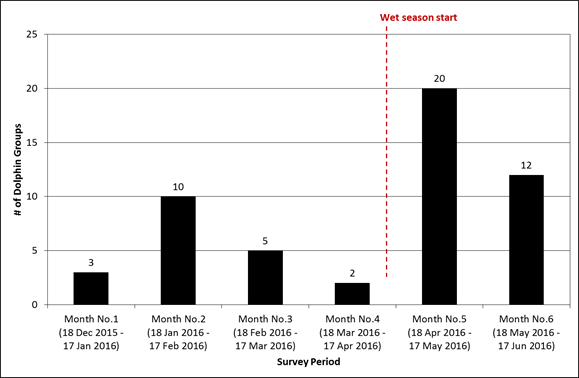
3.2.3
Time of Year
The highest percentage of CWD groups
observed from LKC was during the 5th study period, between
18 April and 17 May 2016 (38.46%), as the wet season began, and the lowest
percentage observed was during the 4th study period, between 18
March and 17 April 2016 (3.85%) (Table 3.6, Figure 3.9).
CWDs were only observed from SC during the 6th survey month between
18 May and 17 June 2016.
Table 3.6: CWD Groups Sighted and Tracked from
Land-based Station by Month of the Year
|
Month |
# of CWD Groups per Sha Chau Station |
# of CWD Groups per Lung Kwu Chau Station |
TOTAL |
|
1st Survey Month (18 Dec 2015 – 17 Jan 2016) |
0 |
3 |
3 |
|
2nd Survey Month (18 Jan 2016 – 17 Feb 2016) |
0 |
10 |
10 |
|
3rd Survey Month (18 Feb 2016 – 17 Mar 2016) |
0 |
5 |
5 |
|
4th Survey Month (18 Mar 2016 – 17 Apr 2016) |
0 |
2 |
2 |
|
5th Survey Month (18 Apr 2016 – 17 May 2016) |
0 |
20 |
20 |
|
6th Survey Month (18 May 2016 – 17 Jun 2016) |
1 |
12 |
13 |
|
TOTAL |
1 |
52 |
53 |
Figure 3.9:
CWD Groups Sighted and Tracked from Lung Kwu Chau
based on Month of the Year
[The numbers above the bars indicate the total number of CWD groups
tracked per study period (prior to filtering data)]
3.2.4
Group Size
The mean group size of CWDs off LKC was 3.54±2.49, ranging from singletons to a
maximum group size of 9 (Table 3.7). The
sighting distribution of CWDs relative to group sizes is represented in Figure 3.10. Group sizes of CWDs were generally smaller
closer to shore, with the largest groups occurring farther from shore, at times
just beyond the SCLKCMP boundary where ferry traffic is routed. Only one group,
with 4 individuals, was observed off SC (Table 3.7, Figure 3.11).
Table 3.7: Land-based CWD Focal Group Size Summary
|
Station |
n (sample size) |
Minimum # Individuals |
Maximum # Individuals |
Mean Grp Size |
Standard Deviation |
|
Sha Chau |
1 |
4 |
4 |
4 |
0 |
|
Lung Kwu Chau |
30 |
1 |
9 |
3.54 |
2.49 |
Figure 3.10:
Plots of CWD Short-track Positions (Standardized Segments) relative to Group
Size obtained from Lung Kwu Chau
[Station is indicated by large green square on land, fix positions of
the CWD groups by green circles (increasing in size with CWD group size), and
SCLKCMP boundary by red lines.]
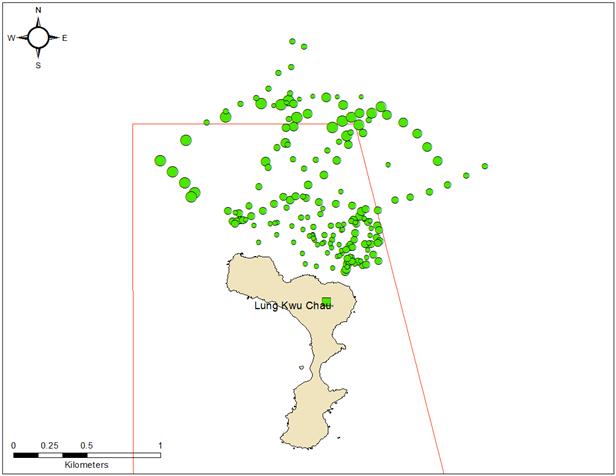
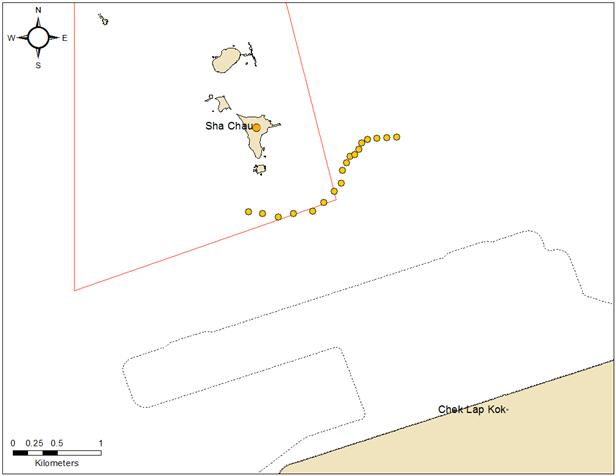
Figure 3.11:
Plots of CWD Short-track Positions (Standardized Segments) relative to Group
Size obtained from Sha Chau
[Station is indicated by large orange circle on land, fix positions of
the CWD group by orange circles, and SCLKCMP boundary by red lines.]
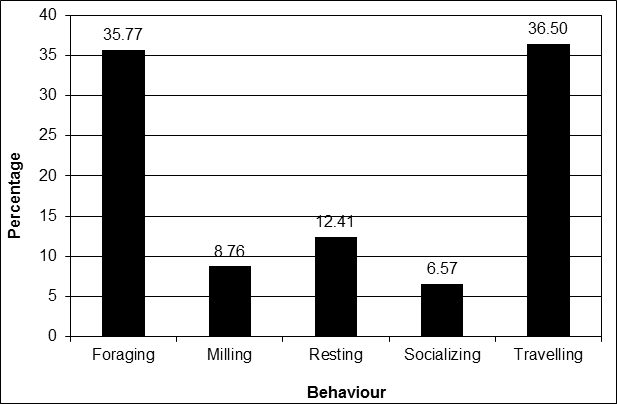
3.2.5
Behavioural State
From
the filtered segments, travelling and foraging were observed most frequently
(36.50% and 35.77%, respectively) off LKC and socialising was observed least
frequently (6.57%) off LKC (Figure 3.12).
Travelling was the only behaviour recorded off SC, excluding unknown category.
Figure 3.12: Percentages of CWD Behavioural States, excluding Unknown Category,
recorded from Lung Kwu Chau
3.2.6
Vessel Activity
Plots of vessels, including high speed
ferries under speed restriction (<15 knots) and high speed ferries (≥15
knots), and CWDs show overlap in habitat off LKC during the baseline monitoring
(Figure 3.13). Nearly 30% of the ferries
tracked off LKC had a mean speed of greater than 15 knots. Same plot except
high speed ferries under speed restriction was also made in Figure 3.14 for SC station.
Figure 3.13: Plots of All Vessel Positions and All CWD Positions (prior to
filtering out short-track data) obtained from Lung Kwu
Chau
[Station is indicated by large
green square on land, fix positions of CWD groups by small green squares, high
speed ferries (<15 knots) by dark grey triangles, high speed ferries (≥15
knots) by black triangles), all other vessels by light grey triangles, and
SCLKCMP boundary by red lines]
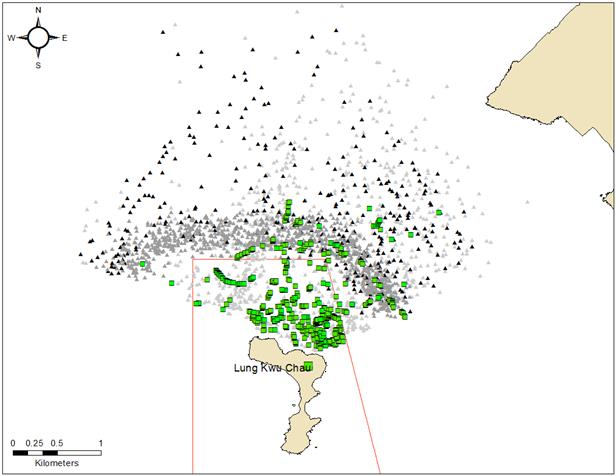
Figure 3.14:
Plots of All Vessel Positions and All CWD Positions (prior to filtering out
short-track data) obtained from Sha Chau
[Station is indicated by large orange circle on land, fix position of
CWD group by smaller orange circles, high speed ferries by black triangles, all
other vessels by light grey triangles, and SCLKCMP boundary by red lines]
3.3
Passive
Acoustic Monitoring
3.3.1
Dolphin Detection Rates Per
Day
During the period of 8 January to 13
May 2016, dolphins were detected in a total of 151 of 31,276 files (0.48% of
files) (Table 3.8). Dolphins were detected on 49
of 80 (61%) days with recording effort (Figure 3.15).
On days with dolphins detected, the mean percentage of files with detections
per day was 0.7%, and the maximum percentage of files with dolphin detections
was 1.7%, on 29 April 2016. Clicks were the only type of dolphin signal
detected. No whistles were detected in data from this monitoring period.
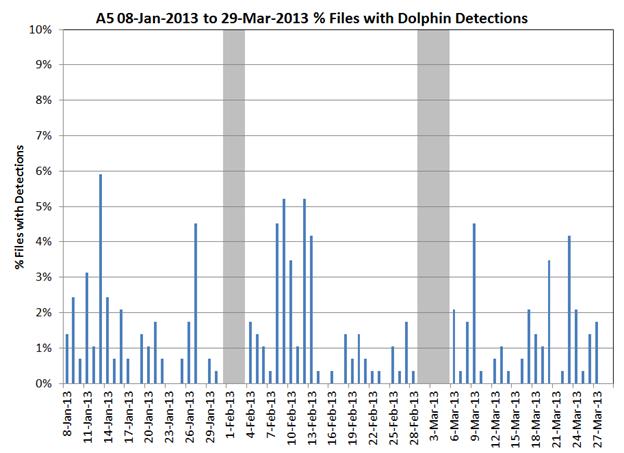
These values represent reductions in
the same metrics compared to previous monitoring at site A5 in 2013. During the
comparable time period of 8 January to 29 March 2013, dolphins were detected in
289 of approximately 21,000 files (1.4% of files), and were present on 60 of 73
recording days (82%) (Figure 3.16).
On those days with dolphins detected during the 2013 period, the mean
percentage of files with detections per day was 1.7%, and the maximum was
5.9%. The percentage of files per day with dolphin detections exceeded 4%
on 8 days during the 2013 time period, whereas in 2016 the percentage of files
with dolphin detections exceeded 4% on only one day.
Table 3.8: Summary of PAM Deployments and Files Recorded
|
Site |
Dep # |
Lat* |
Lon* |
Data start |
Data end |
# recording days |
Total # files |
# files with dolphins |
analysis status |
|
A5 |
1 |
22 20.295N |
113 53.918E |
8 Jan 2016 |
22 Feb 2016 |
46 |
13120 |
82 |
Complete |
|
A5 |
2 |
22 20.295N |
113 53.918E |
25 Feb 2016 |
29 Mar 2016 |
34 |
9652 |
45 |
Complete |
|
A5 |
3 |
22 20.295N |
113 53.918E |
14 Apr 2016 |
13 May 2016 |
30 |
8504 |
24 |
Complete |
Note:
*coordinates obtained from the 3RS EIA (December 2012 - December 2013) A5 site
Source:
Based on monitoring results from 7 January 2016 to April 2016
Figure 3.15: Dolphin Detections as Percentage of Files Per
Day, 8 January to 13 May 2016
[Grey shading
indicates no recording]
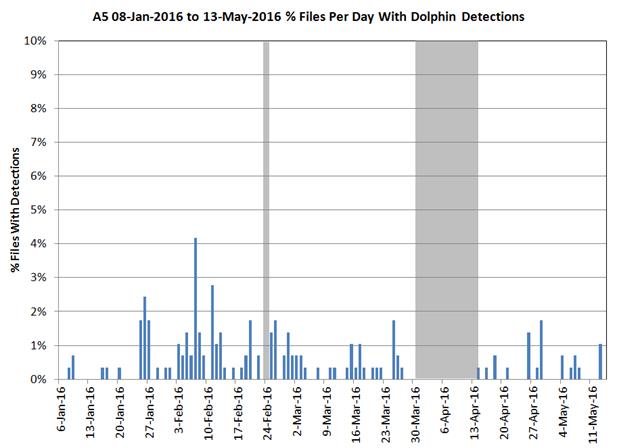
Figure 3.16: Dolphin Detections as Percentage of Files Per
Day from Previous Airport Monitoring Project, 8 January to 29 March 2013
[Grey shading
indicates no recording]
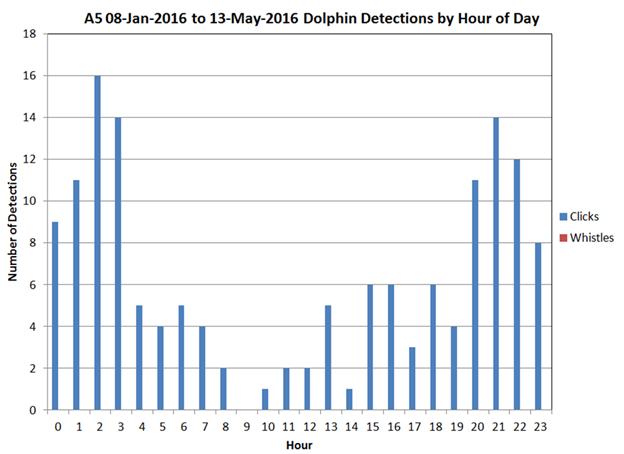
3.3.2
Dolphin Diel Pattern
Dolphin
detection rates at A5 from 8 January to 13 May 2016 were greater at night than
during daytime and exhibited an obvious diel pattern, with peak detection hours
between 0200-0300 and 2100-2200 (Figure 3.17).
This pattern of detection was similar compared to the 2013 monitoring period,
with higher numbers of detections during night-time and fewest detections at
midday (as seen throughout Hong Kong waters, in general).
Figure 3.17: Dolphin Detections by Hour of
Day, 8 January to 13 May 2016
[No whistles were detected in the data from this period]
3.3.3
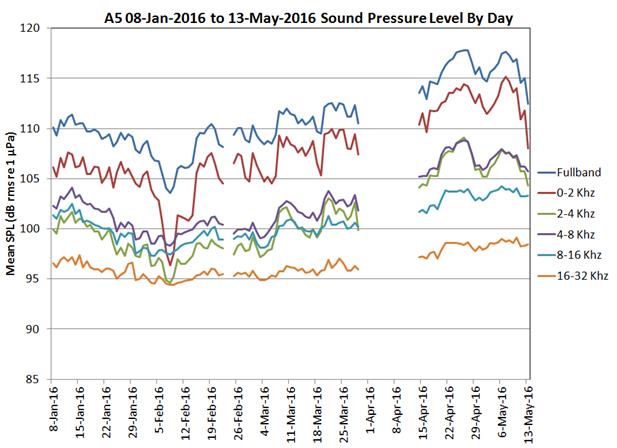
Sound Pressure Levels Per Day
Ambient received noise levels
(referred to as sound pressure levels or SPL) at the EAR were calculated for
each recording within the full frequency bandwidth as well as octave bands of
0-2 kHz, 2-4 kHz, 4-8 kHz, 8-16 kHz, and 16-32 kHz. Mean sound pressure levels
over the full effective recording bandwidth (~0 to 32 kHz) ranged from 104 to
117 dB rms re 1 µPa over the recording period (Figure 3.18). Sound pressure levels in higher octave
bands were approximately 3 to 20 dB lower than full band levels. During the
period of 5-10 February 2016, sound pressure levels in the 0-2 kHz band
declined sharply by approximately 7 dB (affecting the full band level as well),
this likely due to less marine traffic during the period of Lunar Chinese New
Year contributing to this "dip", and "normal" levels resumed after the public holiday. Indo-Pacific
humpback dolphin click and whistle frequencies are above 16 kHz and below 10
kHz, respectively (Sims et al. 2011); however, these sounds were very rare in the
data compared to other sound sources and would not be distinguishable in
ambient noise plots.
Figure 3.18: Daily Mean Sound Pressure
Level (dB rms re 1 µPa), 8 January to 13 May 2016
[Blank area represents no recording]
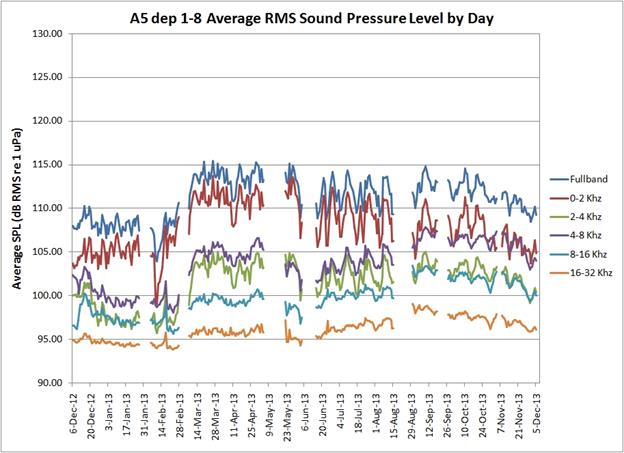
3.3.4
Influence of Ambient Sound Level on Dolphin Detections
The extent to which ambient
received sound levels influenced detectability of dolphin signals is not
quantified for this data set. However, the daily mean SPL for A5 in 2016 was
similar to values reported for the same site over the same period in
corresponding octave bands in 2013, to within approximately ± 2 dB (Figure 3.19). Therefore, the
potential masking effect of background noise on dolphin signals in 2016 was
comparable to any masking effect in 2013. This suggests that the lower dolphin
detection rate in 2016 compared to 2013 reflects a true reduction in dolphin
signals, rather than an increase in background noise resulting in increased
masking of signals.
Figure 3.19: Daily mean Sound Pressure
Level for Site A5 during Previous Airport Project, 2012-2013
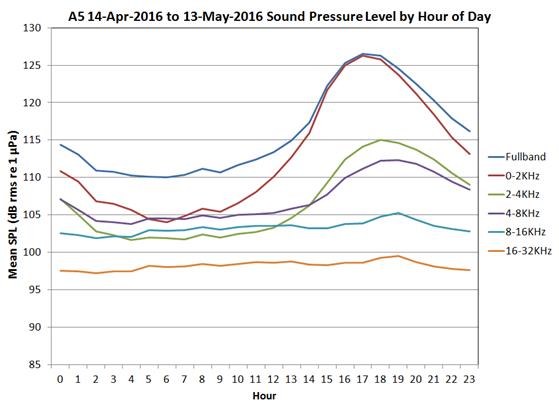
3.3.5
Diel Sound Pressure Level
Mean sound pressure levels plotted by hour revealed a daily peak during
the hours of 1500-1700, which was most pronounced in the lowest frequency band
(Figure 3.20 and Figure 3.21). This is similar to
the diel pattern of sound pressure levels at the same time of year reported
during previous Hong Kong PAM efforts, and is hypothesized to be related to a
local fish chorus, possibly croakers (family Sciaenidae).
Figure 3.20: Sound Pressure Level (SPL) by
Hour of Day, 8 January to 29 March 2016
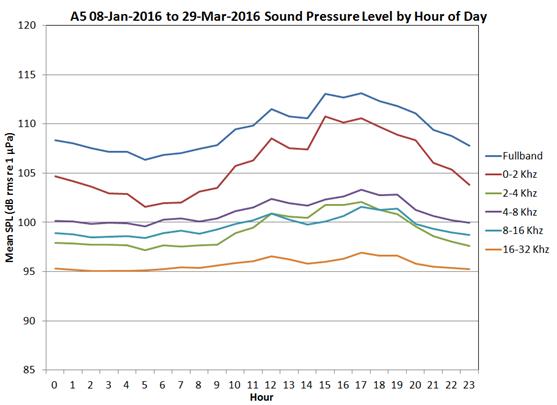
Figure 3.21:
Sound Pressure Level (SPL) by Hour of Day, 14 April to 13 May 2016
4.1
Introduction
Section 10.5 of the Updated EM&A
Manual stated that Action and Limit Levels and an Event Action Plan for Chinese
White Dolphin (CWD) as part of the mitigation measures for the construction of
the Project, shall be proposed by the ET and be agreed with the Agriculture,
Fisheries and Conservation Department (AFCD) and EPD. This section
proposed a consolidated Event Action Plan for CWD during the construction of
the Project, for the agreement with AFCD and EPD.
As mentioned in the Updated EM&A
Manual and the EIA, it is expected that the 3RS reclamation activities would
result in the temporary movement of CWDs away from 3RS works areas during the
construction period, and this may be indicated by a further decline in CWD
abundance in the Northwest Lantau survey area over the period of construction.
As part of the set of required mitigation measures for the construction of the
project, an Event and Action Plan framework has been developed that is intended
to detect any deterioration in ambient environmental quality that could
endanger CWDs or result in an overall decline in CWD numbers in Lantau waters
(NEL, NWL, AW, WL and SWL) as a whole below a certain threshold level.
Appropriate remedial actions are described and taken as part of the plan, intended
to prevent unacceptable deterioration in environmental quality or a reduction
in CWD numbers in Lantau waters as a whole below the limit level that may be
caused by 3RS construction works.
The Event and Action Plan makes use
of data from the baseline CWD monitoring surveys, makes reference from
historical data on some key parameters that are indicative of the health of the
CWD population (and specifically the portion that uses Hong Kong waters as part
of their range), and can be monitored as part of regular EM&A efforts
during construction, providing early warning when particularly serious impacts
may be occurring. The results would be used as a management tool, so that if
the impact on CWD is determined to be from the 3RS construction process, appropriate
measures may then be triggered / considered to minimise possible impacts. A set
of criteria that may trigger certain actions identified have been developed and
are detailed in the following sections.
4.2
Action
Response Approach
The approach proposed in the Updated
EM&A Manual for formulating the Action Level (AL) and Limit Level (LL) for
construction phase CWD monitoring involved using the encounter rate. Encounter
rate provides a direct indicator of the health of CWD population and it can be
determined from the EM&A effort (i.e. CWD
monitoring). Actions will be taken when these levels in Lantau waters have been
triggered. Both the Encounter Rate of Number of Dolphin Sightings (STG) and
Encounter Rate of Number of Dolphins (ANI) from the baseline survey are adopted
as the parameters for determining the AL and LL. The calculation of the CWD
encounter rates for determining AL and LL made use of the dataset from the CWD
Baseline Monitoring undertaken for this Project (conducted between 18 December
2015 and 17 June 2016) as part of the EM&A requirement under the
Environmental Impact Assessment Ordinance (EIAO).
Formulation
of Quarterly Encounter Rates
Quarterly Encounter Rate of Number
of Dolphin Sightings (STG)
Quarterly Encounter Rate of Number of Dolphins
(ANI)
(Notes: 1. Only data collected under Beaufort 3
or below condition was used;
2. A quarter refers to three survey months, and data collected within a quarter
was counted and calculated to obtain the total no. of on-effort sightings,
total no. of dolphins from on-effort sightings and total amount of survey
effort)
The 3RS Project construction works
are expected to result in CWDs temporarily moving away from the 3RS works area,
therefore this encounter rate approach using quarterly dolphin vessel survey
findings to compare with baseline STG and ANI values, is intended to provide a
short to medium term frequency method for monitoring and responding
appropriately to changes in CWD abundance as project works progress. It is
proposed to set the AL and LL in Lantau waters covering Northeast Lantau (NEL),
Northwest Lantau (NWL), Airport West (AW), West Lantau (WL) and Southwest
Lantau (SWL) as a whole as it has been anticipated in the Project EIA that the
number of CWDs in North Lantau waters will decline due the Project and CWDs may
move to other areas around Lantau including West Lantau and Southwest Lantau. A
combined encounter rate can present a general picture of the entire waters
around the Project area and Lantau. The combined quarterly encounter rates STG
and ANI calculated from the dataset of the CWD Baseline Monitoring for the
Project (18 December 2015 to 17 June 2016) are presented in Table 4.1 below.
Table 4.1: STG and ANI for Hong Kong
Western Waters
|
|
Combined (NEL/NWL/AW/WL/SWL) Quarterly Encounter Rate |
|
|
|
18 December 2015 – 17 March 2016 |
18 March – 17 June 2016 |
|
STG |
1.86 |
3.72 |
|
ANI |
9.35 |
15.21 |
Source:
CWD Baseline Monitoring (18 December 2015 to 17 June 2016)
Natural seasonal fluctuations of CWD
encounter rates across the four seasons may cause non-project related
exceedances of AL and/or LL, therefore historical CWD data has been reviewed to
take into account the effect of seasonal fluctuations of CWD encounter rate. The
seasonal variations of CWD quarterly encounter rates based on the AFCD long
term marine mammals monitoring in the past six years (2010 to early 2016)
covering the NEL, NWL, WL and SWL waters were reviewed (Figure
4.1 and Figure 4.2). The findings showed that
in general, the first quarter or winter/spring (Q1, i.e. January to March) of
the year is the low season for CWD encounters, with the values of STG and ANI
consistently being the lowest during Q1 amongst the four quarters over the
years with a decreasing trend (except for one year when Q4 appeared to be the
lowest in 2012). The CWD encounter rates generally increase in Q2 or summer
(except for 2013), with the CWD baseline monitoring for the 3RS project also
showing a similar trend (i.e. encounter rates increase from the first survey
quarter (winter/spring) to the second survey quarter (late spring/early
summer)). Although the encounter rates were lower than the AFCD records, this
is possibly due to various factors not limited to surveys being conducted by
different surveyors, different survey effort in certain waters and different
days for the surveys.
The dataset of the CWD Baseline
Monitoring for this Project has been taken mainly during Q1 to Q2 of 2016
during which time the quarterly encounter rates for STG and ANI were collected
in the first quarter (18 December 2015 to 17 March 2016), thereby capturing the
low season. The dataset is therefore suitable for establishing the AL and/or LL
for future impact monitoring. As the baseline survey did not cover the full
year to cover the peak season encounter rate, the AL and/or LL is subject to
further review when a full year data set is collected. The criteria for
triggering the AL and LL during CWD impact monitoring are detailed in Table 4.2 and Table 4.3
below.
Figure 4.1:
Quarterly Encounter Rates of AFCD’s Monitoring Data
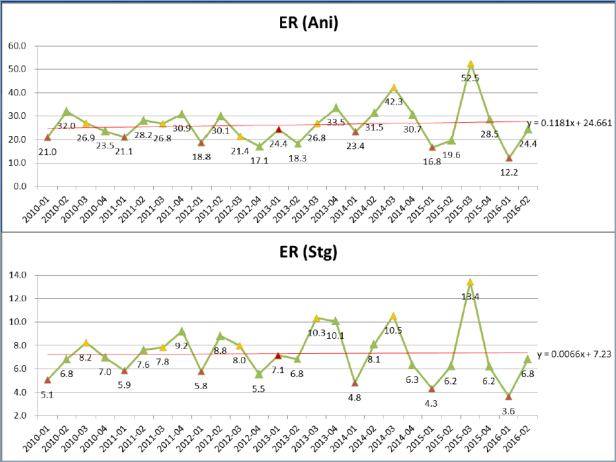
Figure 4.2:
Quarterly Encounter Rates and Running Average Encounter Rates of AFCD’s
Monitoring Data
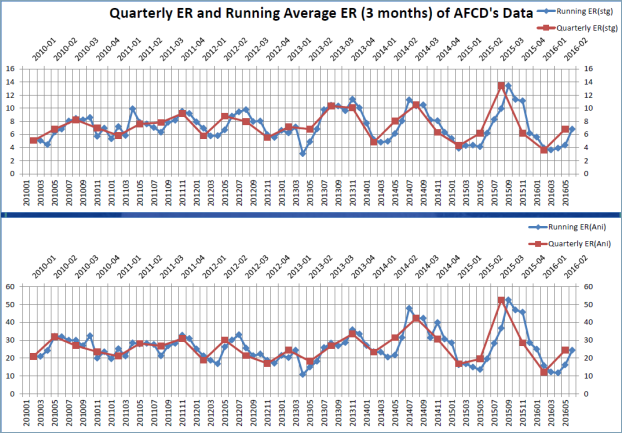
Table 4.2: Approach to Define Action Level
(AL) and Limit Level (LL)
|
|
NEL, NWL, AW, WL and SWL as a Whole |
|
Action Level |
Running quarterly* STG & ANI < low season quarterly encounter rates derived from baseline monitoring data |
|
Limit Level |
Two consecutive running quarterly^ (3-month) STG & ANI < low season quarterly encounter rates derived from baseline monitoring data |
Table 4.3: Derived Values of Action Level
(AL) and Limit Level (LL)
|
|
NEL, NWL, AW, WL and SWL as a Whole |
|
Action Level |
Running quarterly* STG < 1.86 & ANI < 9.35 |
|
Limit Level |
Two consecutive running quarterly^ (3-month) STG < 1.86 & ANI < 9.35 |
[Notes
for Table 4.2 and Table 4.3:
*Action
Level – running quarterly STG & ANI will be calculated from the three
preceding survey months, e.g. if works commence on 1 August 2016, the CWD
impact monitoring report will review the data from 18 May to 17 June 2016
covering two sets of transect surveys for all monitoring areas and the data to
be collected in July and August 2016 (also with two sets of transect surveys
for all monitoring areas) for calculating the quarterly encounter rates STG
& ANI. For CWD impact monitoring for September 2016, data from 1 July to 30
September 2016 will be used to calculate the quarterly encounter rates STG
& ANI;
^Limit
Level – two consecutive running quarters mean if works commenced in August
2016, the first running quarter for reporting will be 18 May to 17 June 2016,
July 2016 to August 2016, and the second running quarter will be July 2016 to
September 2016.
AL
and/or LL will be triggered if both STG and ANI fall below the criteria.]
After the impact monitoring
commences, the combined data from the baseline monitoring, pre-construction
monitoring and the construction phase monitoring data will be used for the
calculation of the quarterly encounter rate. If works commence on 1 August
2016, the CWD impact monitoring report will refer to data from 18 May to 17
June 2016 to ensure that two sets of transect surveys for all monitoring areas
are used for the first month in the quarter with data to be collected in July
and August 2016 (also covering two sets of transect surveys for all monitoring
areas) when calculating the quarterly STG and ANI encounter rates. For CWD
impact monitoring for September 2016, data from 1 July to 30 September 2016
will be used to calculate the quarterly STG and ANI encounter rates. If both
quarterly STG and ANI are lower than the baseline values 1.86 and 9.35
respectively, the action level will be triggered.
For the Limit Level, the second
reporting month will be September 2016 if works commence on 1 August 2016. The
two consecutive running quarterly encounter rates as described above will be
reviewed. If both STG and ANI for two consecutive running quarters be lowered
than the baseline values, the Limit Level will be triggered.
The adoption of running quarter
encounter rate approach will allow short term response to events that triggered
the action / limit levels after review the monitoring data for each month,
which is preferable than the traditional quarterly encounter rate approach that
action/limit levels may only be triggered after 3 to 4 months of the impact
monitoring. Therefore, the running quarter encounter rate approach will also
allow more effective measures to be adopted to mitigate the short term effect
encountered during the construction phase.
To further strengthen the Event and
Action Plan for CWD, it is recommended that upon the collection of 12 months
CWD monitoring data, a review of the annual encounter rate be made. These will
also include the review of potential peak season that have not be realised in
this 6-month baseline monitoring. Should any of the Event and Action Plan be
updated, agreement will be seek from the EPD/AFCD, certify by ET Leader and
verify by IEC prior to implementation of the updated Event and Action Plan.
4.3
Consolidated
Event and Action Plan for CWD Monitoring
The Event and Action Plan, which is proposed
in the Updated EM&A Manual has been reviewed and consolidated based on the
CWD baseline study. Details of the events and actions corresponding to the
action and limit levels are presented in Table 4.4.
Table
4.4: Event and
Action Plan for CWD
|
|
Action |
|||
|
Event |
Dolphin Expert/ET Leader |
IEC |
AAHK / PM |
Contractor |
|
Action Level |
1. Check monitoring data; 2. Repeat data analysis to confirm findings; 3. Review all available and relevant data covered in the EM&A and the survey data collected at the Lantau waters, i.e. NWL, SWL, WL and NEL, to ascertain if the exceedance is due to natural variation or works related; 4. Identify source(s) of impact; 5. Inform the IEC, AAHK/ PM and Contractor; 6. Instruct an increase in the DEZ area to be monitored from 250m to 500m for daytime works; and 7. Increase site inspection and audit frequency to ensure all the dolphin protective and/or precautionary measures (e.g. consider enhancing dolphin watch patrols, phasing of construction works, review of construction methods, etc.) and other relevant measures are fully and properly implemented. |
1. Check monitoring data submitted by ET and the Contractor; 2. Check the data review outcome by ET with the ETL; and 3. Conduct additional site inspection and audit with ET to ensure all the dolphin protective and/or precautionary measures are fully and properly implemented and advise AAHK / PM the audit results and findings accordingly. |
1. Discuss the need for increased site inspection and audit frequency proposed by ET with the ETL, IEC, and the Contractor; and 2. Check the audit results and findings from ET and IEC. |
1. Inform the AAHK /PM and confirm notification of the non-compliance in writing; 2. Conduct site inspection and audit with the ETL and IEC; and 3. Ensure all the dolphin protective and/or precautionary measures are fully and properly Implemented. |
|
Limit Level |
1. Check monitoring data; 2. Repeat statistical data analysis to confirm findings; 3. Review all available and relevant data covered in the EM&A and the survey data collected at the Lantau waters, i.e. NWL, SWL, WL and NEL, to ascertain if the exceedance is due to natural variation or project related; 4. Identify source(s) of impact; 5. Inform the IEC, AAHK / PM and Contractor; 6. Repeat review with the Contractor representatives and IEC to ensure all the dolphin protective measures are fully and properly implemented and advise on additional measures, if necessary; 7. Review previous occurrence of non-compliance events to investigate if there is a longer term trend that needs attention; and 8. ET provides evidence of the suspected source of impact that may be caused by any of the construction activity under works contracts of the project, ET arranges a meeting to discuss with IEC, AAHK and Contractors on the need for further monitoring and/or any other potential mitigation measures (e.g. consider modified design, or consider controlling or temporarily stopping relevant marine works etc.), consultation with AFCD and EPD and submit to IEC any proposal on additional dolphin monitoring and/or mitigation measures for certification where necessary. |
1. Check monitoring data submitted by ET and Contractor; 2. Discussing monitoring results and findings with the ET, Dolphin Experts and the Contractor; 3. Review with the Contractor representatives and ET to ensure all the dolphin protective measures are fully and properly implemented; 4. Discuss further mitigation measures with the ET, AAHK/PM and the Contractor; 5. Review proposals for additional monitoring and any other mitigation measures submitted by ET and Contractor and advise AAHK/ PM of the results and findings accordingly; and 6. Supervise / audit the implementation of additional monitoring and/or any other mitigation measures and advise AAHK/PM the results and findings accordingly. |
1. Convene an expert panel involving IEC (and dolphin experts), AFCD and EPD to review the situation and determine any necessary actions based on the options / mitigation details as proposed by the ET/ Contractors. 2. Discuss further mitigation measures with the ET, IEC and the Contractor; and 3. Supervise the implementation of additional monitoring and/or any other mitigation measures. |
1. Inform the AAHK/ PM and confirm notification of the non-compliance in writing; 2. Discuss further mitigation measures with the ETL, IEC and AAHK/ PM; 3. Review with ET and IEC again to ensure all the dolphin protective measures are fully and properly implemented and carried out additional measures, if necessary; 4. Jointly submit with ET to IEC and expert panel a proposal of additional dolphin monitoring and/or any other mitigation measures when necessary; and 5. Implement the agreed additional dolphin monitoring and/or any other mitigation measures. |
This report summarises the findings of the 6-month CWD baseline
monitoring results and the pre-construction conditions prior to the
commencement of the marine construction works of the 3RS Project. Vessel survey
data from this monitoring period found no CWD in the NEL area. There is initial
indication that SWL and WL areas are being more heavily used by CWDs, and this
may have resulted from CWDs shifting their activities to parts of their home
range in SWL and WL waters to avoid the NEL area. However, despite these
changes, some regions within the North Lantau waters are still being used as
important dolphin habitat (especially the area around Lung Kwu
Chau and the Urmston Road area near Castle Peak).
Vessel surveys have provided data for estimating the density and
abundance of dolphins in Hong Kong during the baseline phase before 3RS
construction (note the baseline period occurred mostly during winter and spring
months, when the dolphin encounter rate in Hong Kong waters tend to be lower
compared to other seasons). There is evidence of decreased use of NEL and
NWL and increased use of the WL and SWL areas.
Based on theodolite data, the waters off Lung Kwu
Chau are still an important foraging area for CWDs. Relative occurrence peaked
in April 2016, concurrent with the beginning of the wet season. Group sizes of
CWDs were generally smaller closer to shore, with the largest groups occurring
farther from shore, at times beyond the SCLKCMP boundary within the SkyPier HSFs route diversion and speed restriction zone.
The PAM data continue to provide useful information, especially on
patterns of dolphin vocalization at night, which has previously been
unavailable to us. The single EAR unit (A5) showed reduced levels of
dolphin detections from previous periods. The diurnal detection of clicks
showed a consistent pattern of higher levels at night compared with the day, which
may be indicative of increased use of echolocation by dolphins during hours of
darkness.
The Action and Limit Levels have been established based on the recent
CWD baseline monitoring data collected for this project. The running quarterly
encounter rates levels will be adopted as the criteria for triggering any short
term to medium term event actions during the construction phase of the project,
with the aim to minimise the impacts on CWDs.
6
References
Bejder, L. (2005)
Linking short and long-term effects of nature-based tourism on cetaceans
(Master’s thesis). Dalhousie University, Halifax, Nova
Scotia, Canada.
Chen, T., Hung, S.K., Qiu,
Y., Jia, X. & Jefferson, T.A. (2010)
Distribution, abundance, and individual movements of Indo-Pacific humpback
dolphins (Sousa chinensis) in the Pearl River
Estuary, China. Mammalia, 74,
117-125.
Gailey, G. & Ortega-Ortiz, J.G. (2002) A note on a computer-based
system for theodolite tracking of cetaceans. Journal of Cetacean Research and
Management, 4, 213-218.
Gailey, G., Wursig, B. &
Mcdonald, T.L. (2007) Abundance, behavior,
and movement patterns of western gray whales in
relation to a 3-D seismic survey, Northeast Sakhalin Island, Russia. Environmental Monitoring and Assessment, 134, 75-91.
Hung, S.K.Y. (2008) Habitat use of Indo-Pacific
humpback dolphins (Sousa chinensis) in Hong
Kong (PhD thesis). University
of Hong Kong.
Hung, S.K.Y. (2015) Monitoring of Marina Mammals in
Hong Kong Water (2014-2015) – Final Report. Submitted to the Agriculture, Fisheries and
Conservation Department of the Hong Kong SAR Government.
Jefferson, T.A. (2000) Population biology of the
Indo-Pacific hump-backed dolphin in Hong Kong waters. Wildlife Monographs, 144, 65 pp.
Lammers, M.O., Brainard, R.E., Au, W.W.L., Mooney,
T.A. & Wong, K.B. (2008) An ecological acoustic recorder (EAR) for
long-term monitoring of biological and anthropogenic sounds on coral reefs and
other marine habitats. Journal of the Acoustical Society of America, 123,
1720-1728.
Lundquist, D., Gemmell, N.J.
& Wursig, B. (2012) Behavioural responses of
dusky dolphin groups (Lagenorhynchus
obscurus) to tour vessels off Kaikoura, New
Zealand. PLos ONE, 7, 9pp.
Martinez, E. (2010) Responses of South
Island Hector’s dolphin (Cephalorhynchus
hectori hectori)
to vessel activity (including tourism operations) in Akaroa Harbour,
Banks Peninsula, New Zealand (Doctoral dissertation). Massey
University, Auckland, New Zealand.
Piwetz, S., Hung,
S., Wang, J., Lundquist, D. & Wursig, B. (2012)
Influence of vessel traffic on movements of Indo-Pacific Humpback dolphins (Sousa
chinensis) off Lantau Island, Hong Kong. Aquatic
Mammals, 38, 325-331.
Sims, P.Q., Hung, S.K. & Wursig, B. (2012)
High-speed vessel noises in West Hong Kong waters and their contributions
relative to Indo-Pacific humpback dolphins (Sousa chinensis
). Journal of Marine Biology, 2012, 11 pp.
Turchin, P. (1998) Quantitative Analysis of Movement:
Measuring and modelling population redistribution in animals and plants. Sinauer Associates, Inc., U.S.A.
Wiggins, S.M. & Hildebrand, J. (2007)
High-frequency Acoustic Recording Package (HARP) for broad-band, long-term
marine mammal monitoring. In: Symposium on Underwater Technology and Workshop
on Scientific Use of Submarine Cables and Related Technologies (ed. by
Anonymous), pp. 551-557.
Wursig, B., Cipriano, F. & Wursig, M. (1991) Dolphin movement patterns: information
from radio and theodolite tracking studies. In: Dolphin societies: Discoveries and puzzles (ed. by K. Pryor & K.S.
Norris), pp. 79-111. University of California Press.